A monthly look at single-family home sales in the Richmond and Sunset Districts.
In October, 41 single-family homes closed in the Richmond and Sunset Districts, up from 31 in September. All but one sold for more than the asking price, and the median home spent 13 days on the market.
This update covers single-family homes with 3 or 4 bedrooms that sold for $3,500,000 or less in the Richmond and Sunset Districts, excluding listings tagged Luxury.
Where Rates Stand
The Federal Reserve raised its benchmark rate by a quarter point on September 16, to a range of 3.75% to 4.00%. At its October 28 meeting it left rates unchanged on a 10 to 2 vote. The two members who dissented, Beth Hammack and Lisa Cook, both wanted another quarter-point increase. The next meeting is in December.
The Fed doesn't set mortgage rates directly. Freddie Mac's weekly survey had the average 30-year fixed rate at 7.11% as of November 12, down from 7.18% the week before and up from 6.24% a year ago.
Closings in this search rose from 17 in August to 31 in September to 41 in October, even with rates higher than they were a year ago.
October Closed Sales
Single-family homes in the Richmond and Sunset Districts that closed October 1 to 31, 2026.
| Richmond Sept | Richmond Oct | Sunset Sept | Sunset Oct | |
|---|---|---|---|---|
| Homes sold | 10 | 9 | 21 | 32 |
| Median sale price | $2,325,000 | $2,025,000 | $2,080,000 | $2,099,500 |
| Median price per sq ft | $1,198 | $1,219 | $1,150 | $1,267 |
| Median days on market | 11.5 | 14 | 12 | 12 |
| Sold over asking | 9 of 10 | 8 of 9 | 20 of 21 | 32 of 32 |
| Median sale-to-list ratio | 132% | 136% | 144% | 144% |
Compared With a Year Ago
Here is October 2026 next to October 2025, using the same filters for both years.
| Richmond Oct 2025 | Richmond Oct 2026 | Sunset Oct 2025 | Sunset Oct 2026 | |
|---|---|---|---|---|
| Homes sold | 7 | 9 | 20 | 32 |
| Median sale price | $2,300,000 | $2,025,000 | $1,822,500 | $2,099,500 |
| Median price per sq ft | $1,070 | $1,219 | $1,070 | $1,267 |
| Median days on market | 10 | 14 | 13.5 | 12 |
| Sold over asking | 7 of 7 | 8 of 9 | 18 of 20 | 32 of 32 |
| Median sale-to-list ratio | 126% | 136% | 121% | 144% |
Closings were up from 27 to 41. The Sunset's median sale price rose 15 percent, from $1,822,500 to $2,099,500, and the Richmond's fell 12 percent, from $2,300,000 to $2,025,000. The Richmond comparison is 7 sales against 9, and the typical home that sold was smaller this year.
Median price per square foot was higher in both districts: $1,070 to $1,219 in the Richmond and $1,070 to $1,267 in the Sunset. Median days on market were the same in both years, at 13 days.
Market Observations
The Richmond's median sale price fell from $2,325,000 to $2,025,000, a drop of 13 percent. Only 9 homes closed in the Richmond this month, and they were smaller than September's: the median size was about 1,560 square feet, down from about 1,988. Price per square foot went the other way, from $1,198 to $1,219.
The Sunset picked up, with 32 closings compared with 21 in September. Every one of them sold for more than the asking price. The median sale price was nearly flat ($2,080,000 to $2,099,500), while the median price per square foot rose from $1,150 to $1,267. With only a few dozen sales, the mix of homes can move those two numbers in different directions.
The Sunset's median sale-to-list ratio was 144 percent, similar to September. List prices here are often set low on purpose, so a ratio like that reflects how a home was priced as much as how much buyers paid.
Homes also sold quickly. The median was 13 days on market across both districts, and 9 of the 41 sold within a week. The slowest took 36 days.
Sales Pipeline
Below are the 3 and 4 bedroom single-family homes in the Richmond and Sunset Districts, listed at $3,500,000 or less, that hadn't closed as of November 16.
| Richmond | Sunset | |
|---|---|---|
| Active listings | 5 | 14 |
| Median list price, active | $1,863,000 | $1,791,944 |
| Pending sales | 6 | 10 |
| Median list price, pending | $1,996,500 | $1,495,000 |
| On hold | 2 | 3 |
On November 16 there were 19 active listings across both districts, compared with 41 closings in October. Five are in the Richmond and 14 are in the Sunset. The Richmond has more homes under contract (6) than for sale (5).
Of the 16 pending sales, 13 went into contract between November 3 and November 13, so most of what is pending is recent. The median active listing has been on the market 11 days.
It helps to keep asking prices in perspective. The October closings in this search had a median list price of $1,495,000 and a median sale price of $2,068,000, so a list price in the pipeline doesn't say much about where a home will end up. What the pipeline does show is that buyers are still making offers and that fewer homes are for sale than sold last month.
What Buyers Should Know
The Fed doesn't set mortgage rates, but lender pricing can shift within days of a Fed decision. If you're close to making an offer, ask your lender what a rate lock would cost you right now.
Plan around recent sales rather than the list price. In this search, the share of homes selling over asking was 88% in August, 94% in September, and 98% in October. October's median list price was $1,495,000 and the median sale price was $2,068,000.
Pay attention to listings that have been sitting. Among homes for sale on November 16, the median had been listed 11 days. One Sunset home had been listed since June, and a Richmond home had been listed 66 days. Homes that sit usually have a reason, and there can be room to negotiate on repairs or closing dates as well as price.
What Homeowners Should Know
Sunset closings in this search went from 14 in August to 21 in September to 32 in October. The median sale price moved from $1,959,000 to $2,080,000 to $2,099,500. Three months isn't enough to call a trend. The number of sales has grown much faster than the median price.
If you compare these figures with numbers from other sources, check what each one includes. This update leaves out homes under 3 bedrooms, homes over 4 bedrooms, and sales above $3,500,000, so a median that includes them can look quite different.
Buyers' financing costs still matter if you're thinking about selling. Mortgage rates are around 7%, up from about 6.2% a year ago, which affects what buyers can afford to pay. In October, 40 of 41 homes in this search still sold over asking.
Neighborhood Spotlight: HI NRG, 5801 Geary Blvd
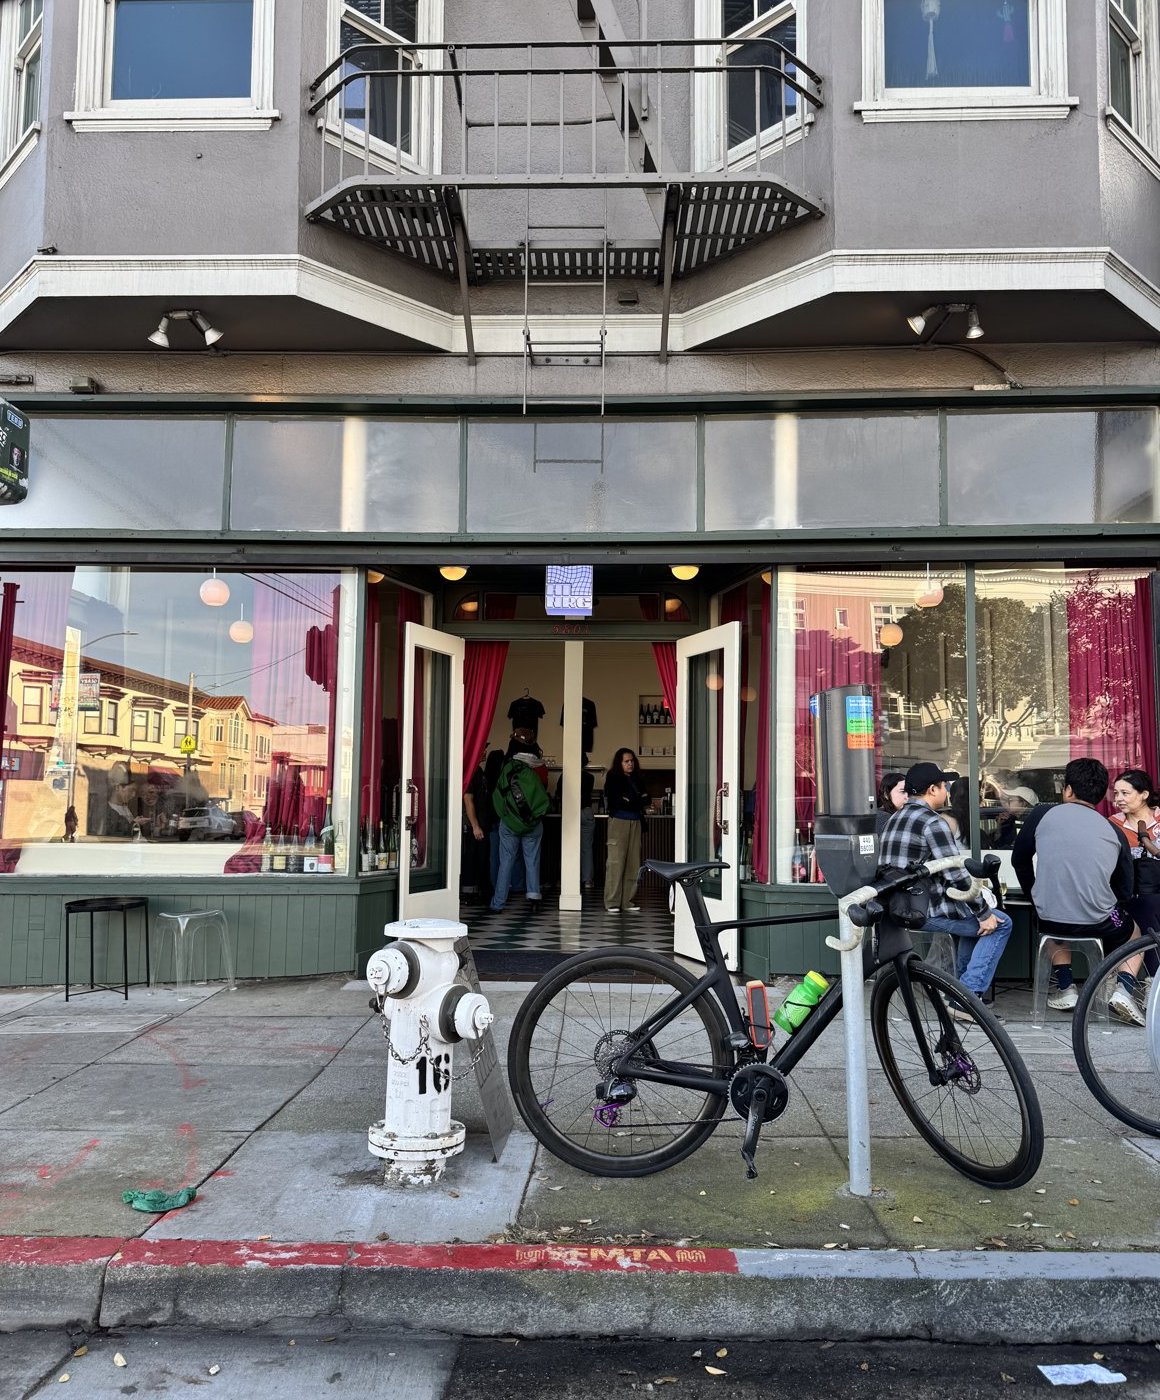
HI NRG started as a coffee pop-up and opened its own space at 5801 Geary Blvd. in the Inner Richmond in September, run by owners Luis Gonzalez and Nathan Kruse. The sign out front lists coffee, music and wine. Inside there are velvet curtains, a checkered floor, a disco ball and a DJ booth with turntables. Mission Local had a first look at the space when it opened.
That's the update for October. If you have questions about the market, or you're curious what homes near you have been selling for, feel free to reach out.
Connor Wong
Licensed Real Estate Salesperson, DRE #02249100
Basalle Wong Realty, Inc., 2543 Clement St., San Francisco
About the data: SFAR MLS single-family residence sales in San Francisco. Richmond is MLS District 1 and Sunset is MLS District 2, including all subdistricts in each. Closed sales are 3 and 4 bedroom homes with a sale price of $3,500,000 or less, excluding listings tagged Luxury, closed October 1 to 31, 2026. September 2026 and October 2025 figures were calculated on the same basis, and each sale is counted in the month of its MLS status date, which for closed sales is the closing date. The same $3,500,000 cap applies in both years. The pipeline figures come from a separate search run November 16, 2026, with the same property filters and a list price cap of $3,500,000. Median is the middle value. Sale-to-list ratio is each sale's price divided by the list price in the MLS export, and the table shows the median across sales. Price per square foot uses MLS living area and leaves out sales with no square footage listed. MLS data is not verified by the broker or MLS.